Representative End User Clients


Representative Automation Clients
Representative Software Clients


A company incurs capital expenditure (CapEx) to acquire or upgrade physical assets, including property, plant, and equipment. In this periodic report, ARC Advisory Group looks at a number of different manufacturing industries to identify the current CapEx trends in India. We calculate CapEx in two separate segments: based on the money spent on acquiring and upgrading total fixed assets, and on the money spent on acquiring and upgrading the plant and machinery.
While ARC also publishes a separate global Capital Expenditures report for leading industries in all world regions, this report focuses exclusively on India’s capital expenditure analysis and includes the CapEx trends for leading industries in the country. These include automotive, cement, chemical & petrochemical, electric power, metals, oil & gas and refining, food & beverage, and pharmaceutical.
Industrial companies are seizing the present growth opportunities that India offers. Companies are building best-in-class industrial facilities to meet the growing needs of the country’s expanding consumer class. Major investments have been planned for infrastructure development. These should help push the domestic steel companies to increase production. The plan to expand and upgrade refineries to meet India’s Bharat Stage (BS) emissions standards for vehicle fuels is also under way. The Government of India implemented it BS VI transportation fuel mandate on April 1, 2020. However, certain exemptions and extensions have been given to automotive manufacturers due to the pandemic and nationwide lockdown. Indian refiners, asked to produce BS VI fuel for sale in India in April, are now reconfiguring their processes to be able to comply. Some of the major cities have already started supplying BS VI fuels. However, more production and distribution channels are required to complete the process. While sectors like power generation and cement are currently burdened with overcapacity and underutilization of assets, in the long run, the rise in domestic demand should increase value creation through these assets. On the infrastructure front, the government has allocated huge investments for building roads, railways, airports, and ports; and companies are likely to ramp up their capacity expansion activities to meet domestic demand in the coming years. According to ARC Advisory Group’s India CapEx Survey, capital spending as a percentage of revenue is greatest in the country’s electric power, oil & gas, and chemical industries.
The overall CapEx in India declined in 2016 and 2018. The structural reforms in the form of demonetization in late 2016 and implementation of the Goods and Services Tax (GST) in mid-2017, led to a short-term dip in industrial activities. India has nearly overcome this disruption and is expected to sustain the growth momentum going forward.
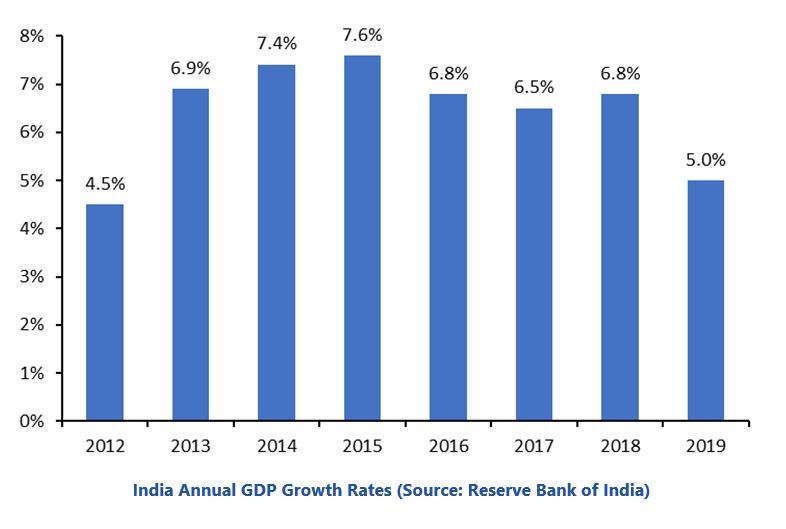
India’s GDP was approximately $2.9 trillion with a per capita GDP (PPP) of around $7,034 in 2019. India’s GDP growth rate was 6.2 percent in 2019. In terms of purchasing power parity, India’s GDP was valued at around $11.0 trillion, and was the third largest in the world in FY 2019-20.
According to the Finance Ministry of India, the annual growth rate of the economy was 6.2 percent in FY 2019-20, compared with 6.8 percent in FY 2018-19. The IMF has projected a sharp contraction of 4.5 percent for the Indian economy in 2020, a “historic low,” citing the unprecedented COVID-19 pandemic that has nearly stalled all economic activities. The country’s GDP is driven mainly by the service sector, which constitutes over 60 percent. The services sector includes trade, hotels, transport, communication & services related to broadcasting, financial, real estate & professional services, public administration, and defense. Agriculture, the main occupation in India, accounts for over 12 percent of the GDP. Manufacturing accounts for nearly 15 percent of the GDP, while construction constitutes around 8 percent; and other industries like mining, quarrying, electricity, gas and water together constitute the remaining. The industrial sector based on Index of Industrial Production (IIP) registered a growth of 0.6 percent for FY 2019-20, compared to 5.0 percent during FY 2018-19.
The Purchasing Manager’s Index (PMI) for the manufacturing sector, started at an expansion mode in January and decelerated in March, indicating weak manufacturing conditions. Even though it grew in May, it further decelerated from August to October. The PMI gradually increased in November and the last quarter of the year, indicating growth in the country’s manufacturing sector due to rise in domestic demand.
India’s National Manufacturing Policy aims to uplift the manufacturing sector and has set a target of 25 percent share of GDP from manufacturing by 2022. The country’s overall exports (merchandise and services combined) aggregated at around $528 billion in 2019-20, exhibiting a negative growth of 1.4 percent over the last fiscal year. Petroleum products, precious stones, drug formulations & biologicals, gold and other precious metals continue to be top exported commodities, with the fastest growth seen in drug formulations & biologicals in 2019-20. India’s total imports decreased by 6.3 percent to $598.6 billion in FY 2019-20 over the same period last year. Crude petroleum, gold, petroleum products, coal, coke & briquettes constitute top import items, with fastest growth seen in electronics in 2019-20. There was a decline in the exports majorly due to the decline in shipment of gems, cotton yarns, jewelry, petroleum products, carpets and handicrafts. The slowdown of demand in global markets and moderation in commodity prices are some of the major reasons for the decline in India’s exports. The country’s top five trading partners continue to be the US, China, UAE, Saudi Arabia, and Hong Kong. Major industries in India include textiles, telecommunications, chemicals, food & beverage, steel, cement, refining, electric power, pharmaceuticals, and IT & software.
India demonetized high-value currency notes in November 2016, resulting in a sharp dip in the manufacturing and construction sectors. The effect on some industries was more pronounced than the others due to lack of liquid cash.
The labor-intensive construction industry, along with the cement industry and medium- and small-sized secondary steel sectors also witnessed slow growth. However, the effects of demonetization were temporary and started to wane by the end of mid-2017. But at that point, the GST was introduced, affecting supply chains, especially those in which small traders were suppliers of intermediates to larger manufacturing companies. The liquidity crunch, weak global business sentiments, and trade war impacted the economic growth. Although the economy is reviving demonetization and GST, the economic condition is still predicted to be low due to the prevailing pandemic situation.
ARC Advisory Group’s India Capital Expenditure Survey 2019 tracks total capital expenditure, capital expenditure on plant and machinery, total revenue, total assets, and asset turnover. The sample size includes 90 companies from eight major industries representing more than $405 billion revenues in 2019. This capital expenditure survey is based on the analysis of the information from the annual reports of India’s leading companies in the following key growth industries: automotive, cement, chemical & petrochemical, electric power, metals, oil & gas and refining, pharmaceutical, and food & beverage.
In 2019, India was the third-largest energy consumer in the world after China and the United States in 2019. The country’s need for energy supply continues to climb due to its dynamic economic growth, population growth, and modernization over the past several years. According to EIA, since 2010, the total production of petroleum and other liquids in India was about one million barrels per day (bbl/d). However, production is expected to fall in 2020. Crude oil and its condensate production has declined over the past few years reaching 40,000 bbl/d to 667,000 bbl/d in 2019. Two-thirds of India’s total liquid production is from crude oil and condensate.
In the past several years, it became evident that energy prices will have a large impact on manufacturing in all industries. The energy required to generate heat, cooling, steam, compressed air, electricity, and such others is becoming an increasingly important cost factor that must be measured, monitored, and controlled, just as any other cost component. Increasing raw material and energy prices are a source of concern for both manufacturers and automation suppliers since they impact production cost directly.
Consumption has been the major contributor to India’s growth story. However this contributor has moderated quite a bit in recent times, falling from 71.5 percent if GDP during 2012-2014 to 69.8 percent during 2015-2019. This declined further, falling to 57.1 percent by June 2020. Private consumption remains one of the key drivers for India’s economy. Private final consumption expenditure decreased significantly from 66.2 percent of the GDP during 2012-2014 to 57.5 percent in 2015-2019. This was due to a slowdown in demand for the automotive, fast-moving goods, and real estate sales sectors. The consumption levels have been declining in both rural and urban areas. Rural incomes have been falling due to low agricultural product prices; hence farmers are buying fewer tractors and two wheelers.
In recent years, the economy witnessed a gradual transition from a period of high and variable inflation to more stable, low-level inflation through 2018. The inflation rate had been decreasing gradually from 12.3 percent in 2008 to 3.6 percent in 2018. However, the inflation rate increased to 4.5 percent in 2019 due to factors such as supply side inflation and increased labor cost, which increase commodity prices.
The declining exchange rate for the rupee is affecting the country’s economy, making imports more expensive. However, some imports, such as oil, cannot be reduced, negatively impacting the country’s deficit. The rupee is expected to depreciate further over concerns about the US-China trade war, a slowdown in global trade, foreign institutional investment (FII) outflow pressures, rising crude oil prices, and the political uncertainty.
India’s National Manufacturing Policy (NMP) aims to lift the manufacturing sector and has set a target of 25 percent share of GDP within a decade and creating 100 million jobs. The policy also aims to enhance the manufacturing sector’s global competitiveness. Some of the related initiatives include setting up a national manufacturing and investment zone (NMIZ) to promote investments in the manufacturing sector, green technologies, and skill development programs to cater to the needs of the manufacturing sector. The policy should enable the country to emerge as a global manufacturing hub with extended forward and backward integration with the global supply chain.
While the state can only create the necessary policy ambience, the key players who can exploit the growth opportunities are the industry thought leaders. Meeting the consumer demand, which continues to remain relatively good compared with many other countries, rests with the industrial companies and the strategies they adopt to fulfill the demand while protecting their margins. While there is further scope to refine it, the state has played its part by announcing the NMP.
ARC Advisory Group clients can view the complete report at ARC Client Portal
If you would like to buy this report or obtain information about how to become a client, please Contact Us