Representative End User Clients


Representative Automation Clients
Representative Software Clients


A company incurs capital expenditure (CapEx) to acquire or upgrade physical assets, including property, plant, and equipment. In this periodic report, ARC Advisory Group looks at several different manufacturing industries to identify the current CapEx trends in India. We calculate CapEx in two separate segments: based on the money spent on acquiring and upgrading total fixed assets, and on the money spent on acquiring and upgrading the plant and machinery.
While ARC also publishes a separate global Capital Expenditures report for leading industries in all world regions, this report focuses exclusively on India’s capital expenditure analysis and includes the CapEx trends for leading industries in the country. These include automotive, cement, chemical & petrochemical, electric power, metals, oil & gas and refining, food & beverage, and pharmaceutical.
Industrial companies are seizing the present growth opportunities that India offers. Companies are building best-in-class industrial facilities to meet the growing needs of the country’s expanding consumer class. Major investments have been planned for infrastructure development. These should help push domestic steel companies to increase production. The plan to expand and upgrade refineries to meet India’s Bharat Stage (BS) emissions standards for vehicle fuels has also been implemented.
The Government of India implemented the BS VI transportation fuel mandate on April 1, 2020. Despite many challenges, India successfully managed the timely implementation of BS VI. This new emission standard required significant changes in hardware, like improvements in engine combustion, and calibration along with the introduction of after-treatment devices; all these required heavy investments. However, with the collaborative and focused approach across the value chain, India ensured a smooth transition.
While a few sectors are currently burdened with overcapacity and underutilization of assets, eventually, the rise in domestic demand should increase value creation through these assets. On the infrastructure front, the government has allocated huge investments for building roads, railways, airports, and ports; and companies are likely to ramp up their capacity expansion activities to meet domestic demand in the coming years. According to ARC Advisory Group’s India CapEx Survey, capital spending as a percentage of revenue has improved compared to the previous year.
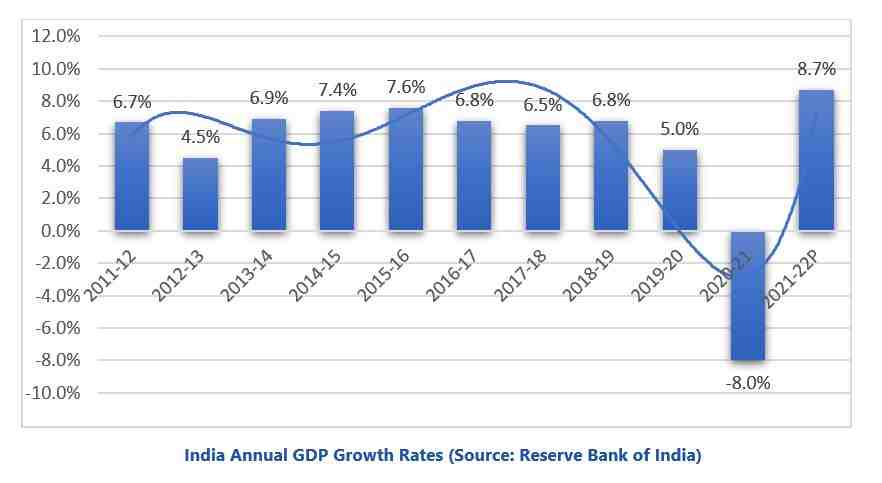
India’s GDP was approximately $3,177.92 billion with a per capita GDP (PPP) of around $6675.35 in 2021. India’s GDP value growth in 2021 stands at 8.7 percent, 1.5 percent higher than the real GDP of 2020. For the current fiscal year, i.e., 2022- 23, the RBI has projected GDP to grow by 7.2 percent, which places India among the swift-growing economies of the world. India’s GDP in market exchange rates is expected to reach $5 trillion by 2027. By that year, India’s GDP in purchasing power parity terms will exceed $16 trillion (up from $10 trillion in 2021). In terms of purchasing power parity, India’s GDP was valued at around $9 trillion in FY 2022-23. With population growth in the early 2030s at 1.5 billion, which means adding GDP (PPP) to $22.50 trillion by 2032. The path from $9 trillion to $22.5 trillion will bear an average real GDP growth rate of 8.5 percent over the coming 10 years.
According to the provisional National Income estimates, the country’s GDP during 2021-22 is 8.7 percent as compared to a contraction of 6.6 percent in 2020-21. The IMF revised India's forecast from 1.6 percentage points from 9 percent in January 2022 to 7.4 percent in July 2022.
The country’s GDP is mainly driven by the service sector, which constitutes over 55 percent, including information technology (IT) and IT-enabled services (ITES). Agriculture is the main occupation in India, and the Gross Value Added by agriculture, forestry, and fishing was estimated at $314.51 billion in FY2021-22. The country’s overall exports (merchandise and services combined) aggregated at around $669.65 billion in April-March 2021-22, jumping by 34.50 percent over the same period last year.
India’s Manufacturing PMI increased to 55.3 in October 2022 from 55.1 in September, surpassing anticipations for a slowdown to 54.9 and remaining above its long-run normal of 53.7. October data showed historically noticeable expansions in factory orders and volumes of purchases, while product growth outpaced its long-run average despite devitalizing to a four-month equatorial. Pivoting to charges, the overall rate of cost inflation was successively at its weakest twice, while the rate of charge inflation eased to its weakest since February.
Looking ahead, Indian manufacturers remain confident of a rise in production volumes by October 2023, citing better deals and marketing efforts. National Manufacturing Policy aims to uplift the manufacturing sector and has set a target of 25 percent share of GDP from manufacturing by 2022. According to Laghu Udyog Bharati (LUB), a group that works to support and improve the MSME sector in India, the percentage of manufacturing Micro, Small, and Medium Enterprises (MSMEs) in the country's GDP is predicted to increase by 100 percent by 2025.
A PLI scheme for automobiles and auto parts valued at Rs. 25,938 crores ($3.37 billion) was approved by the government in September 2021 to expand domestic manufacturing capacity, including the development of electric and hydrogen fuel cell vehicles. Twenty businesses received approval for this PLI scheme in February 2022, with accepted applicants proposing an investment of Rs. 45,016 crores $5.86 billion).
The government has launched several organizations to draw investment, including the National Single Window System (NSWS), the India Industrial Land Bank (IILB), the Industrial Park Rating System (IPRS), the National Infrastructure Pipeline (NIP), and the National Monetization Pipeline (NMP). Cumulative). The cumulative value of exports for the period April-September 2022 was $382.31 billion as against $315.89 billion during the same period in 2021. India’s cumulative value of imports for the period April-September 2022 was $469.47 billion, as against $340.75 billion during the same period in 2021. Major industries in India include textiles, telecommunications, chemicals, food & beverage, steel, cement, refining, electric power, pharmaceuticals, and IT & software.
ARC Advisory Group’s India Capital Expenditure Survey 2021 tracks total capital expenditure, capital expenditure on plant and machinery, total revenue, total assets, and asset turnover. The sample size includes 94 companies from eight major industries representing more than $500 billion in revenues in 2021. This capital expenditure survey is based on the analysis of the information from the annual reports of India’s leading companies in the following key growth industries: automotive, cement, chemical & petrochemical, electric power, metals, oil & gas, refining, pharmaceutical, and food & beverage.
The biggest concern facing our economy is the slowdown in personal consumption. India's GDP has always been dominated by personal consumption, which has remained a significant driver of GDP growth. Its decline as a percentage of GDP during the previous three years—down from 60.5 percent in 19–20 to 57.5 percent in 21–22—was already documented, and this issue required urgent and deliberate resolution. The severe slowdown in rural consumption over the past 6 to 9 months has increased the urgency of the effects of the overall decline over the last three years.
Exports, government spending, and fixed capital creation have all had a strong rebound since COVID-19, except for consumption. According to the advanced estimates of the Government of India, the Private Final Consumption Expenditure (PFCE) in the gross domestic product at current prices in India for the year 2022 is valued at Rs.133.52 trillion. Private consumption in India made up 61.1 percent of nominal GDP in Q1 2022-23, up from 55.5 percent in the same quarter previous financial year.
In recent years, the economy witnessed a gradual transition from a period of high and variable inflation to more stable, low-level inflation through 2018. The inflation rate has been decreasing gradually from 12.3 percent in 2008 to 3.6 percent in 2018. However, the inflation rate increased to 6.2 percent in 2020 due to factors, such as supply-side inflation and increased labor cost, which increased commodity prices.
For the month of September 2022 (over September 2021), the annual rate of inflation based on the Wholesale Price Index (WPI) figures for all of India is 10.7 percent (provisional), compared to the 12.41 percent reported in August 2022. The Food Index, which consists of "Food Products" from the Manufactured Products group and "Food Articles" from the Primary Articles group, has declined from 176.0 in August 2022 to 175.2 in September 2022.
Based on the WPI Food Index, the rate of inflation declined from 9.93 percent in August 2022 to 8.08 percent in September 2022. The increase in prices of mineral oils, food items, crude oil and natural gas, chemicals and chemical products, basic metals, electricity, textiles, and other items as compared to the same month last year is the main cause of inflation in September 2022.
The declining exchange rate for the rupee is affecting the country’s economy, making imports more expensive. However, some imports, such as oil, cannot be reduced, negatively impacting the country’s deficit. The rupee is expected to depreciate further over concerns about the US-China trade war, a slowdown in global trade, foreign institutional investment (FII) outflow pressures, and political uncertainty. The rupee has lost 9.8 percent in the calendar year 2022.
National Manufacturing Policy aims to uplift the manufacturing sector and has set a target of 25 percent share of GDP from manufacturing by 2022. The government plans to infuse $26 billion in investment in the manufacturing sector, over the next five years, starting FY 2021-22. The policy also aims to enhance the manufacturing sector’s global competitiveness. Some of the related initiatives include setting up a national manufacturing and investment zone (NMIZ) to promote investments in the manufacturing sector, green technologies, and skill development programs to cater to the needs of the manufacturing sector. The policy should enable the country to emerge as a global manufacturing hub with extended forward and backward integration with the global supply chain.
While the state can only create the necessary policy ambience, the key players who can exploit the growth opportunities are the industry thought leaders. Meeting the consumer demand, which continues to remain relatively good compared with many other countries, rests with the industrial companies and the strategies they adopt to fulfill the demand while protecting their margins. While there is further scope to refine it, the state has played its part by announcing the NMP.
India’s economic growth continues to propel the demand for fuel, energy, and basic materials. CapEx as a percentage of revenue increased for every industry; however, electric power’s CapEx was higher compared to other industries. NTPC, Tata Power, and Power Grid Corporation of India Ltd. (PGCIL) share most of the capital investments for generation and transmission, respectively. CapEx spending has improved across all the industries when compared to 2020. The metals and electric power industries are major investors in capital assets and made significant capital investments in 2021.
ARC Advisory Group clients can view the complete report at ARC Client Portal
If you would like to buy this report or obtain information about how to become a client, please Contact Us