Representative End User Clients


Representative Automation Clients
Representative Software Clients


The first electric demand curve was the “duck curve”, and now the “dragon and shark curves” show how our daily electric loads are changing.
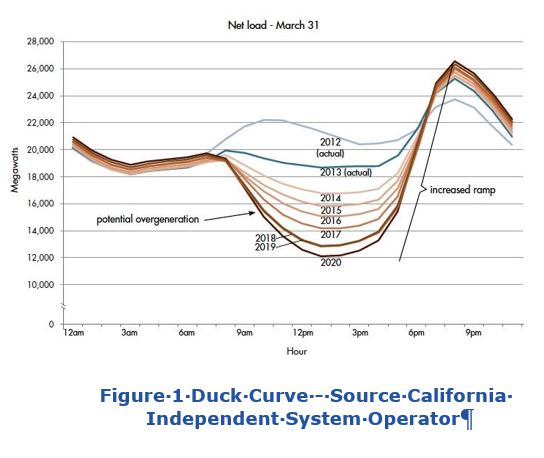 These curves are the projected electric grid daily load profiles whose shape reminds us of animals. The daily rhythm of people and businesses working and sleeping shape the load profile. Where large increases in electric generation from solar energy are occurring, there are challenges for grid management that are illustrated by the duck curve. When midday solar power dominates grid production, dispatchable power is pushed off the grid. As the sun goes down this dispatchable power needs to quickly ramp up to meet the evening demand. Analysis by CAISO (California Independent System Operator) created the duck curve. It is a shape for load demand that will likely appear in all locations that have high solar PV penetration without significant energy storage.
To head off the grid management problems of the duck curve, locations, like California and Hawaii, are often requiring new grid connected solar PV systems to include battery storage capable of consuming midday generation and releasing it to handle the evening peak load.
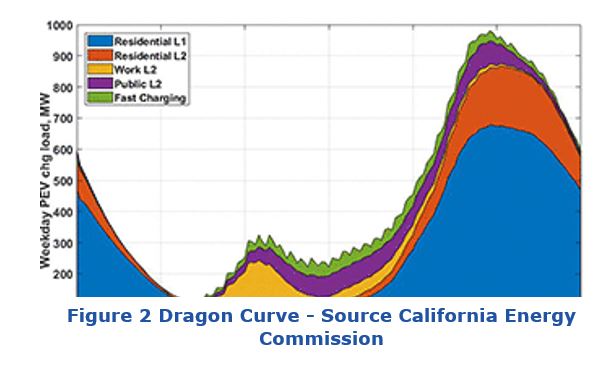 Just as grid planners are developing methods to store solar energy and release it hours later to meet the evening load, the dragons and sharks are arriving to cause trouble. While the installation of powerful DC EV chargers will put larger demand spikes on the grid (300kW or more per car), these have more potential to disrupt weak local distribution systems. There is little reason to fear the fast DC charging loads on the larger grid systems, as these random power spikes are mostly part of the projected increase in the demand for electric power. The bigger problem is the sharks. This is when EV owners tend to coordinate the power demand spikes as they arrive home from work and plug their cars in. While the level 2 home chargers are much less powerful than the DC fast chargers, the large number of EV owners plugging in at the same time will be a problem.
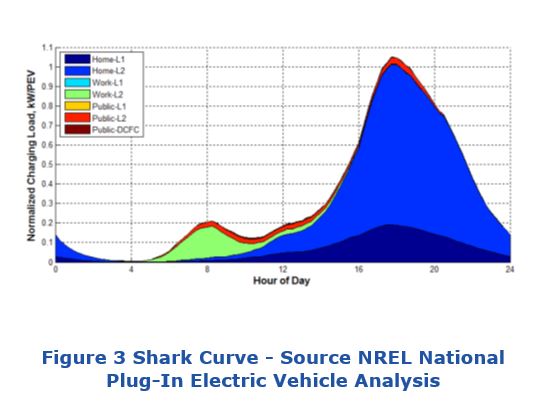 NREL has made projections for the daily load curve as EV adoption increases, and that curve looks like a shark dorsal fin. NREL projections show a likely peak at 5-6pm. It was Aug 29, 2018 from 5-6pm when the peak load of 26024 MW occurred for New England last year. That is precisely the same hour NREL projects for the increased EV load spike.
Many US states are planning aggressive grid scale battery deployment targets. Standalone batteries, solar PV with batteries, and other forms of energy storage, like pumped hydro for example, are needed to form a complex network of microgrids that could export power to meet peak load demands. Alternatively, consumers could act to shift peak load. This is foreign concept for many consumers, but the shark curve is likely to finally bring consumers into a grid controlling role.
If EVs are the problem, why install massive grid batteries to meet peak loads when using EV batteries appear to be cheaper? There are two stages for this. First utilities can encourage EV owners to schedule their charging after 9pm, when loads are lower. The second method would be to directly use EV batteries with V2G (vehicle to grid) capability and create a consumer grid service market that rewards EV owners who put power into the grid when it is needed. EV makers currently are not supporting V2G, as battery cycles do reduce battery life and impact vehicle warrantees. The value of V2G energy to utilities is far greater than the cost of EV battery degradation. Solar PV owners could run their house from the EV battery as well as make money by exporting power to the grid when the grid needs help.
One method to involve consumers might be to equip homes with smart meters and adjust pricing every 10 minutes, like the LMP (Local Marginal Price) method utilities uses as a market incentive for industrial and commercial customers. Consumer experience with this method shows that some dramatic price shifts may be required to get consumers to act, and that could result in some consumer backlash. Any control scheme that requires human actions to look at the price of electricity and then adjust thermostats, EV chargers, hot water heaters, and other loads is bound to have operational problems based on the humans that I know.
Automation is the obvious solution. EVs, thermostats, and electric hot water heaters can be automated for load shifting and often this is completely painless. Consumers are OK with saving money when it is painless. This automation can be done without smart meters. For example, my own local utility is offering free EV wall chargers (worth about $650) that include WiFi-based controls in exchange for the utility being able to occasionally block the charger during peak load times of 5-9 pm, effectively deferring loads into non-peak times. This saves the utility transmission and capacity costs if EV charging and other large loads are not active during peak load conditions. WiFi controlled circuit breakers have great potential to be a part of the new breed of automated consumer load management.
There has always been a challenge to include consumers in grid load management, and finally new automated load management products are finding their way to market. Regulators, utilities and product suppliers are rushing to create new products that link real-time projections of peak load to consumer loads. Now, the smallest residential consumers can be part of the IEN (Integrated Energy Network) that is described by the recent EPRI initiative as a means to make electric power cleaner, cheaper, safer, and more reliable.