Representative End User Clients


Representative Automation Clients
Representative Software Clients


Let’s talk about time series analysis and some of its more challenging aspects. Be careful with data right now. Look at it from various angles and re-think your own tools.
Ok, now that I have your attention. Yes, of course there is a dip. At ARC, we see that Q3 and Q4 will be the quarters hit the most, and we have published a series of reports for clients on Corona already. Our research shows that for total automation we expect a dip somewhere around -15% to -20%, but this is highly dependent on the individual industries. We will soon publish more reports for clients, so if you are a client, you can check here.
I actually want to use the current situation to talk a bit about time series analysis and some of its more challenging aspects. Don’t worry, there will be no big theoretical discussion here, but I want to show you the implications, using the corona crisis as an example.
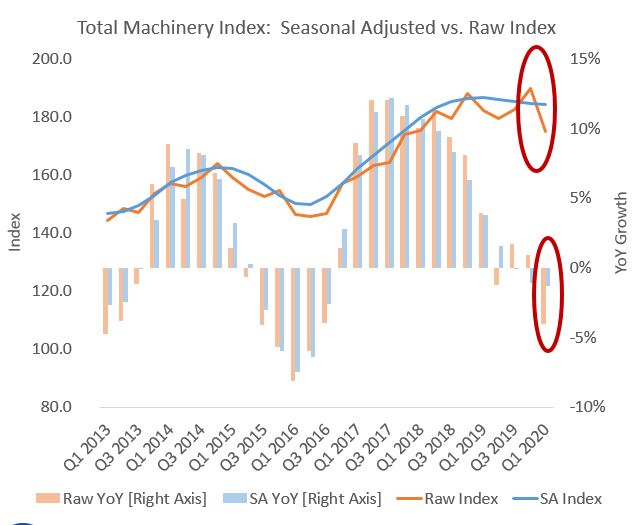
The chart shows ARC’s machinery based on 400+ publicly listed machinery builders, which are indexed using a Paasche Index to avoid jumps, when adding new data.
At ARC, we typically use seasonally adjusted data. This has the advantage that smaller “jumps” are flattened, and we do not over-interpret certain findings. Such as the “spike” we have in Q4 2019 or the dip in Q2 2019, while the market was more or less flat. But now, in times of Corona Crisis, the seasonally adjusted line (blue) does not show any dip. How can this be?
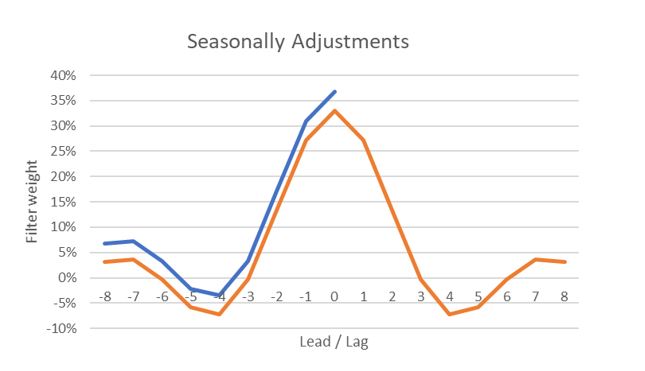
We use an optimized filter according to Baxter/King, which adopts along the time series, it can be considered as optimal, but it has challenges at the end of the time series, which is unfortunately the most interesting part of it. At the end of the time series, the filter uses past data to calculate the current seasonally adjusted value. But, in the past there was no corona! We can use ARMA or ARIMA models to help us out here, but they also use past data to forecast the future. And, in the past there was no corona! So, we are at the beginning of a structural break, which cannot be smoothed or forecasted using past information or data, it does not work.
While this may sound nerdy, it has a very clear and simple implication (highlighted in red in first chart above):
What does that mean? Be careful with data right now. Look at it from various angles and re-think your own tools in BI. Worst case may be, as a strategist or manager, your tool may give you the wrong basis for decision making.