Representative End User Clients


Representative Automation Clients
Representative Software Clients


As the Coronavirus 19, or COVID19, started to spread, the financial and manufacturing world watched intensely, relying on technology for their information. The scary thing about the Coronavirus is that Social media started reporting that there were shortages of masks, hand wash, soap and gloves. Manufacturers, like 3M, have ramped up production of N95 masks, which are supposed to provide some protection if you are working with patients presenting symptoms.
In China, some factories were converted into mask manufacturers. Citizens are becoming more familiar with how virus’ are spread. Demand for soap, bleach and hand sanitizer are at an all-time high and it’s becoming hard to get. It also helps identify locations where major manufacturing and supply chain disruptions may occur for other products, like car parts or active pharmaceutical ingredients. People are also more familiar with masks and what they do. Data mapping has been used in the past to determine causes of disease. For example, Cholera outbreak maps helped early health experts determine that it was not contagious from person to person but spread through unsanitary water or food supply sources. More cholera deaths were prevented after improving water supply sanitation based on hand drawn analytic mapping done by hand. Fast forward to today where mapping can be automated to near real-time and outbreaks predicted based on factual data and larger populations.
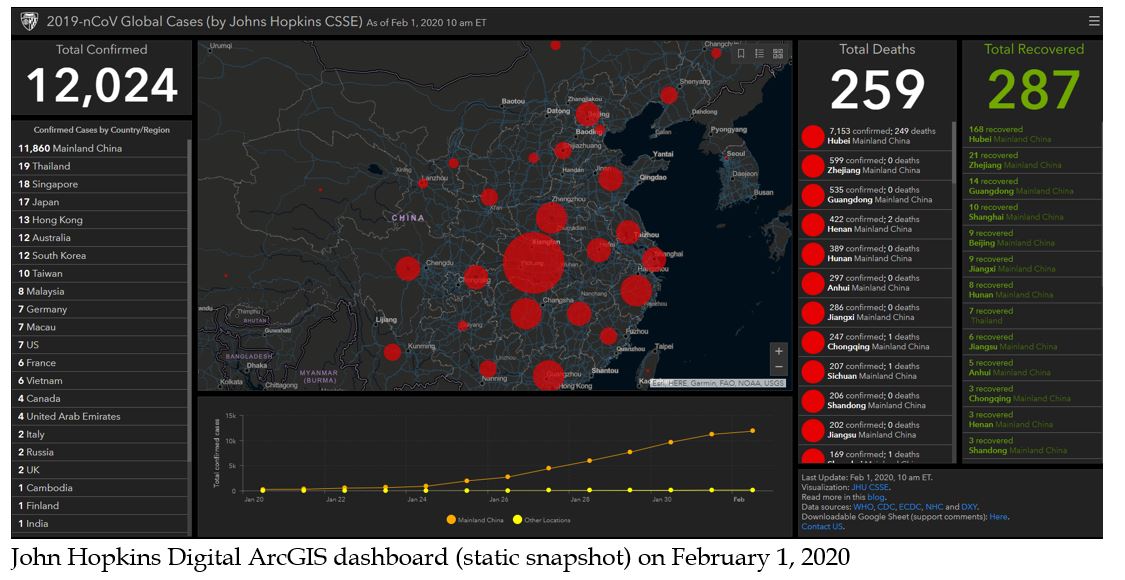
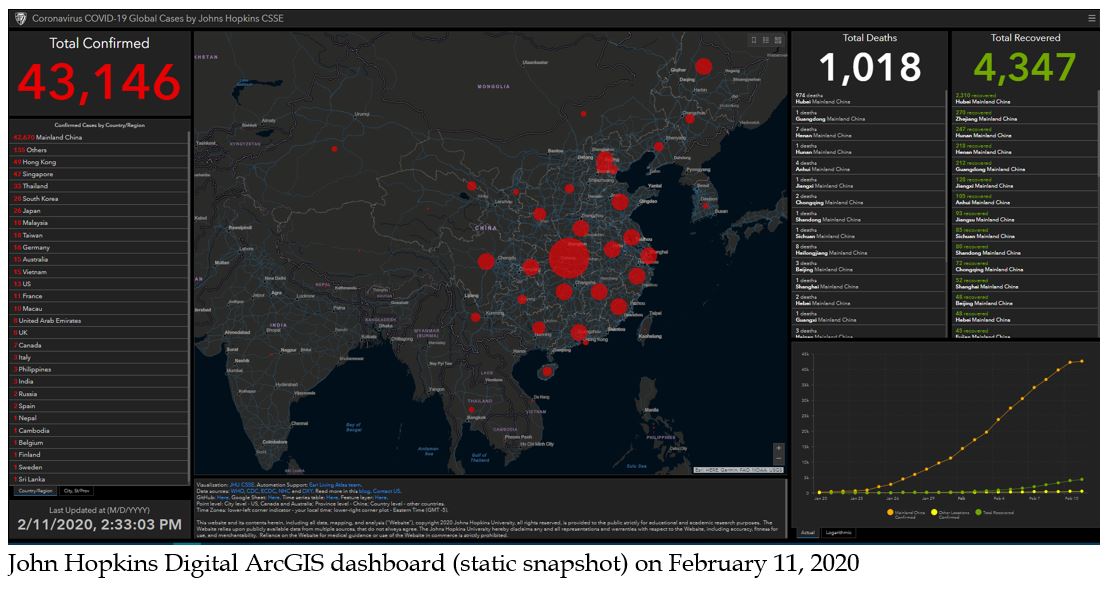
Today, John Hopkins, is considered a very credible medical resource, so when the University decided to add their digital dashboard that combined GIS mapping intelligence with their analytics, ARC began watching the web-based interactive dashboard that used analytics to track the virus spread change daily throughout the world. The digital dashboard is hosted by the Center for Science and Engineering (CSSE) at John Hopkins, to visualize and track reported cases in near real-time. The information is based on health organizations data and especially helpful, in light of some false social media claims. It appears that many of the news sources have started citing the John Hopkins dashboard for their coronavirus numbers as well. According to the John Hopkins website, the data is confirmed from regional and local health centers including the World Health Organization (WHO) data, US Center for Disease Control (CDC), European Centre for Disease Prevention and Control (ECDC), National Health Center (NHC), China CDC , DXY, Australia Government Department of Health, Government of Canada and other local health authorities. The visual dashboard is provided by ArcGIS and is interactive. You can see total cumulative cases and existing cases total, by country in a graphical way that gives you intelligence at a glance. The updates are done almost in real-time but some of the cases reported by the news have not been recorded or confirmed by the global health agencies immediately, so there is a delay in reporting on the website, which is actually updated once the sites listed update their figures.
ARC has been keeping an eye on the Coronavirus since January 22 in China due to the impact on the global economy and businesses. Currently, due to the stoppage of flights from highly infected areas some areas have been able to slow down infection rates which is mainly caused by travel and meetings.
While there is a lot of conflicting and misinformation out there in the news and social media, and a lot of the politicians don’t have a background that gives them an in depth understanding of the virus, it is very difficult for people to really understand what is real and what is false. We did not get a lot of information from the WHO either. For example, many people don’t know who to believe. Should they wear a mask if they have pre-existing lung diseases or asthma or diabetes that make them at higher risk, or if they are older? Is it more dangerous to wear a mask or to walk around the supermarket without one? Well, we think that depends upon how you handle the masks and understand red (contaminated) and green (uncontaminated) zones, and what difference washing your hands can make after you touch anything especially something in a contaminated area. Differentials in handling and wearing a mask can make a difference in contamination. China is encouraging their citizens to wear masks, but the United States is discouraging their citizens, because they do not think the general public is capable of understanding how contamination works unless they already think they have the virus and are showing symptoms, in which case they should NOT be walking around in public with a mask. Part of the reason for the discouragement of masks is that there is a shortage of N95 masks, and priority should be for medical professionals use first.
The disease is supposed to be spread by touch more than by air – although if someone sneezes or coughs on you, you would likely be susceptible to catching the virus, and this is where masks might help if handled properly e.g. changed often when wet and anytime the outer surface is touched by hands, and they are washed according to specs. But there are a lot more issues that the public health professionals should concern themselves with – like how well a plane is disinfected or how well public bathrooms are cleaned and disinfected, particularly in airports, airplanes and public transportation. One issue resulting from the new mask shortage problem is that construction workers who rely on N95 masks to protect them from work related dust or plasma cannot get them to do their work.
Chances are that the virus will die out once temperatures reach 86 degrees, or over the summer, but it is likely to reappear in late fall or winter of this year. An analysis of twenty-two earlier studies of similar coronaviruses, including severe acute respiratory syndrome (SARS) and Middle East respiratory syndrome (MERS), published online this month in the Journal of Hospital Infection, concluded that human coronaviruses can remain infectious on inanimate surfaces for up to nine days at room temperature, unless on a stainless steel or copper surface where it lasts for around two hours. However, they can quickly be rendered inactive using common disinfectants and may also dissipate at higher temperatures. It is not yet clear whether the new coronavirus resembles SARS in how it presents itself, but its molecular makeup seems to most resemble SARS of all the coronaviruses.
The virus seems to be worse than the flu in terms of death rates, and there is no vaccine or immunity. However, in a year or year and a half, if there is a vaccine that can prevent the disease, people will return to living their normal lives as if nothing happened, supply chains will return to normal, people will travel, and go out to eat, and the financial world will return to normal.
Many communities are planning on relying on technology in high risk areas for education, and companies on virtual events and webinars, and this is a terrific idea as long as the technology infrastructure that they are relying on can accommodate the extra bandwidth that will be required in specific locations. Other communities are planning on shutting down entirely, which will make the public rely on the internet - ordering supplies online and working online - which will also rely on a strong technology infrastructure.
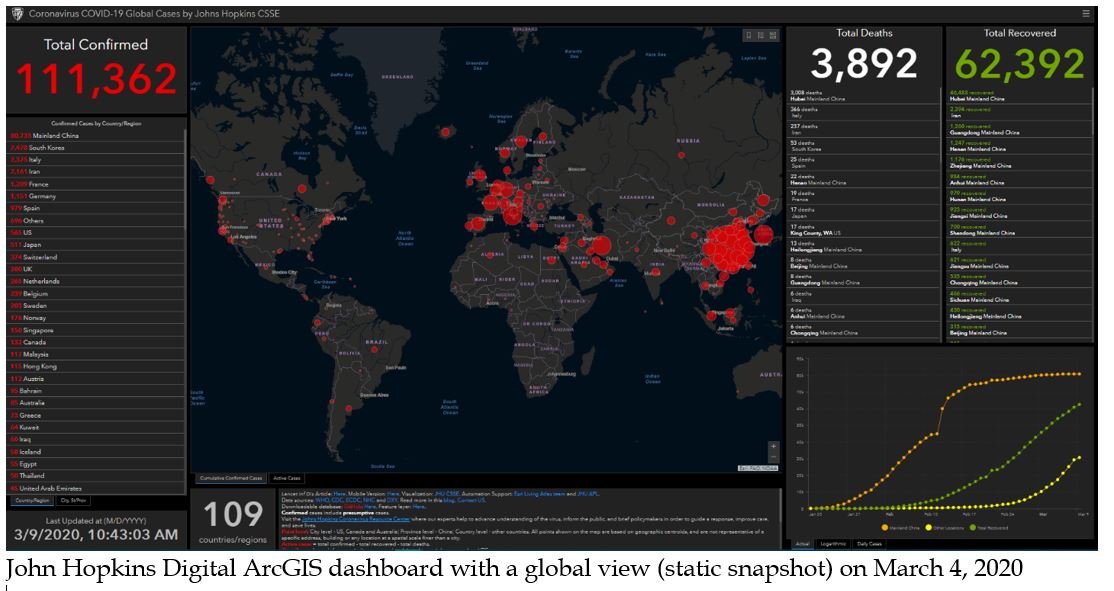
Today according to the digital dashboard the virus has infected more than 111,300 people and killed at least 3,890 worldwide (but less than the seasonal flu), according to John Hopkins digital dashboard. But the experience of the pandemic, or almost pandemic, (WHO has not declared at this time) will change the world forever. People will learn to rely on technology in a way that they have never relied on technology before. The analytics are even predicting where the next outbreak will appear, and based on this near pandemic, the analytics algorithms will get even better in the future. Analytics and digital dashboards are here to stay and can be used to determine and predict the next location of an outbreak and may even help countries and health specialists prevent future infections. There will be more challenges as the disease outbreak progresses, but the algorithms will get better as we accumulate more valid data, and the predictions will be even more precise. And, digital dashboard intelligence, visualization and analytics will be relied on even more by industry to determine product demands, manufacturing locations and supply chain challenges and more.