Representative End User Clients


Representative Automation Clients
Representative Software Clients

As today’s companies strive to better understand their businesses, insight from all organizational levels are needed to get a complete view of organizational health and business drivers with the use of analytics. There is an ongoing challenge of making sense of disparate data so it can be interpreted as actionable information.
Not only is it difficult to mine all this data, but until recently, most software programs available required specialized expertise and investments in traditional, and costly, analytics solutions. Even with sufficient investments in hardware and software tools, the skill sets needed to use these solutions have traditionally been solely in the domain of trained data scientists and statisticians assigned to organizations’ quant staffs.
Until recently, many organizations have been reluctant to initiate analytics initiatives at the business unit level. The challenge has often been centered around understanding how they can best navigate through unprecedented amounts of data, both structured and unstructured, to even begin to come to any meaningful conclusions. For many, sifting through massive amounts of data residing in various databases, data warehouses, and data lakes is a seemingly impossible task.
However, changes are rapidly occurring across industries and departments. New and innovative business intelligence and analytics solutions are being brought to market by forward-looking vendors. There is a revolution of sorts occurring in many firms today, including asset-intensive industries. New intuitive and powerful solutions are being introduced by progressive business intelligence, data visualization, and analytics providers, such as ABB, IBM, Infor, Microsoft, MicroStrategy, Oracle, SAP, SAS, Tableau, Qlik, and others. In addition to being relatively easy to use, these solutions can also offer connectivity to a wide range of data sources, and often come with a lower total cost of ownership.
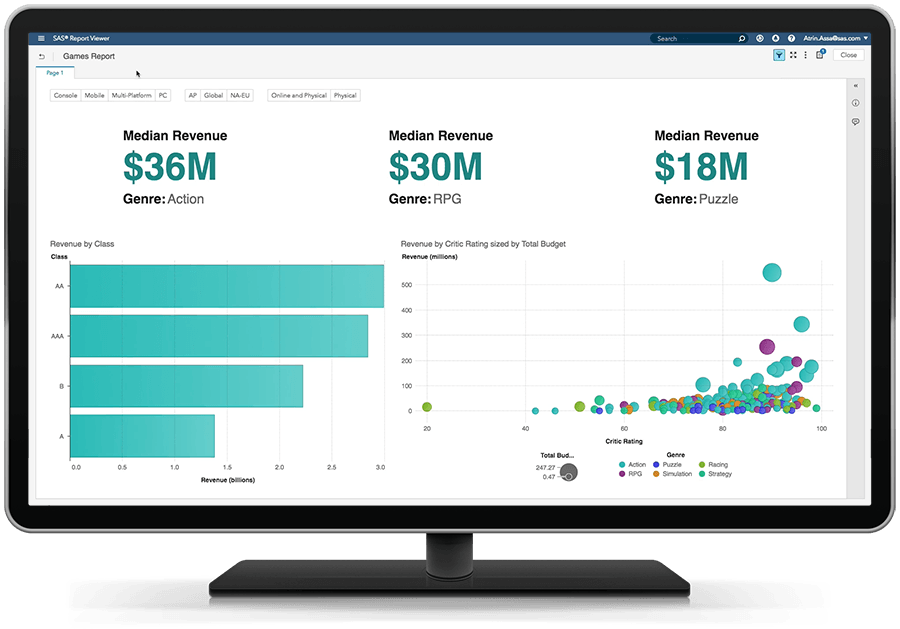
Figure 1: Example of Analytics Output Suitable for Business Users
An increasing number of vendors are offering such techniques as intuitive UIs and data visualization tools as a way for users to construct models based on visual representations of the data. These solutions are both powerful and easy-to-use and can allow business users the ability to create queries and some models without the need to understand, write, and execute SQL queries.
With these solutions, the rules and sequences for data evaluation are set by manipulating visual elements, much like setting joins and formulas in some report writer programs. Still, the underlying SQL-based code can be made available for those experts who want, or need, to review the data models in greater detail. The result has been a new class of data visualization and analytics solutions being offered in the market that are powerful, yet intuitive and easy to use.
While these solutions can be used by quant staff and business users alike, the latter now have a tool from which they can run various predictive models and scenarios, something that was not generally available until recently. And while these easier-to-use solutions do not replace the highly trained and experience quant personnel, they can allow better use of their time and expertise.
For many organizations, IT, quant staff, and business users such as maintenance and operations personnel, can now work much more closely as teams. In such cases, the data experts often guide the business users in a first pass at modeling test-and-learn scenarios, with data experts collaborating in the quality testing and fine-tuning of the models, making them more efficient and scalable.
This collaboration also helps business users better model “what-if” scenarios. This can include some predictive and propensity models, as well as making predictions about underlying machine performance and repair, including mean-time-to-repair (MTTR) and mean-time-between-failures (MTBF), and other KPIs.
These are exciting times for business users interested in using analytics to better understand their operations. The many options available with the latest analytics and data visualization solutions offer new opportunities for business to better understand equipment health and business conditions and trends, and barriers to optimum equipment performance.